Hi there,
I have been trying to find the underlying patent data that allows me to reproduce the following graph by the World Bank (querying "Patent applications, residents" and "South Africa"):
https://data.worldbank.org/indicator/IP.PAT.RESD?locations=ZASince I wasn't able to reproduce anything like this using Lens.org and other patent databases, I reached out to the World Bank for help. They reproduced the same graph via the "WIPO IP Statistics Data Center" (
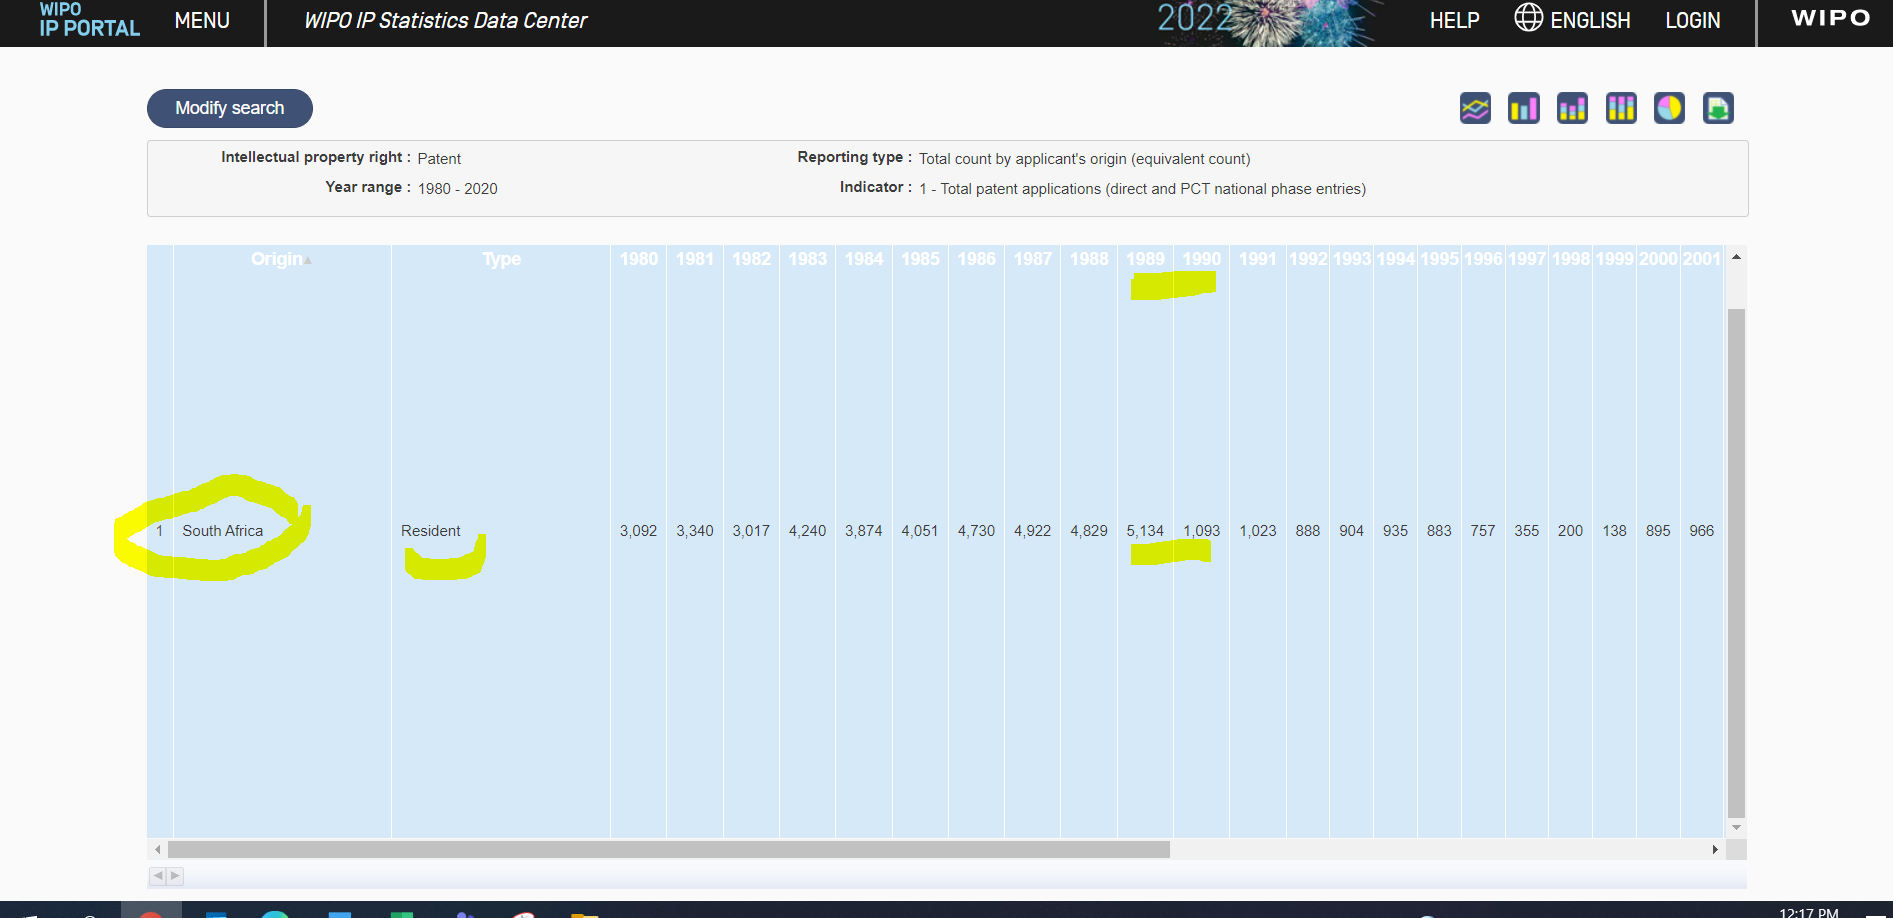
https://www3.wipo.int/ipstats/editIpsSearchForm.htm?tab=patent), see screenshot here:

They also said that the data came from the WIPO and is searchable via Patentscope.
My problem is that I cannot produce the raw data via Patentscope. When I query Patentscope, I would assume something like ARE:(ZA) AND AD:(1998) return 200 patent applications from South African residents (see 1998 in screenshot above).
However, for 1998, Patentscope only returns 158 applications. From 1980 till today, Patentscope finds fewer than 10k applications for ARE:(ZA), while the World Bank aggregated a total of 58,773 applications over the same period. I tried different filters etc., but just do not get anywhere closer.
My questions are:
Can anyone think of (a) a possible explanation for the differences between aggregates in the graphs and the Patentscope results, and, if the issue lies with Patentscope, (b) alternative databases that would allow me to download patent data that, when aggregated, more closely resemble the numbers in the graphs?
Every hint is appreciated. Thank you very much.
Best wishes,
Andy